
Areesha Naeem
Data Analyst | Power BI · SQL · Python · DAX
Data Analyst | Power BI · SQL · Python · DAX
Most people drown in data. I find the story inside it.
I'm a Data Analyst specializing in Power BI, SQL, and Python — with hands-on experience turning messy, large-scale datasets into dashboards and insights that help people make real decisions. I completed a Data Analyst internship at Pakistan Aeronautical Complex (PAC), Kamra, where I built automated KPI dashboards and reports for operational teams.
Here's what that looks like in practice:
My toolkit:
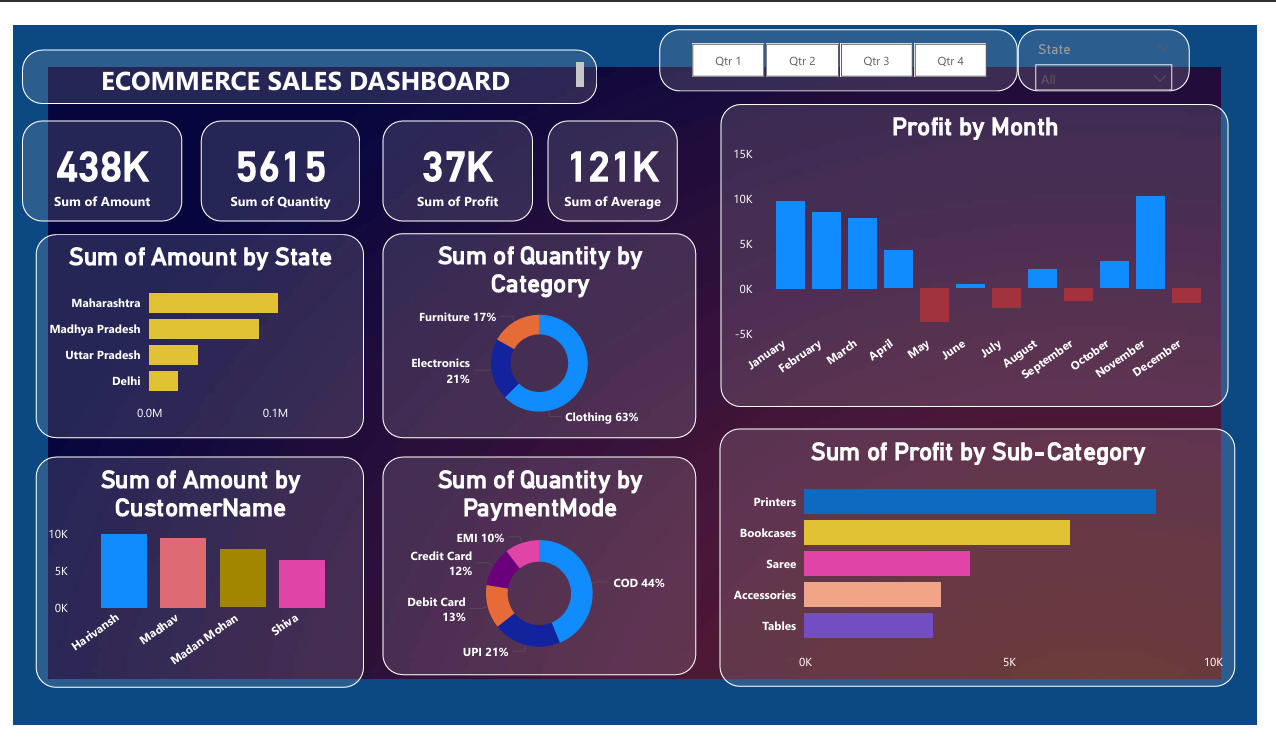
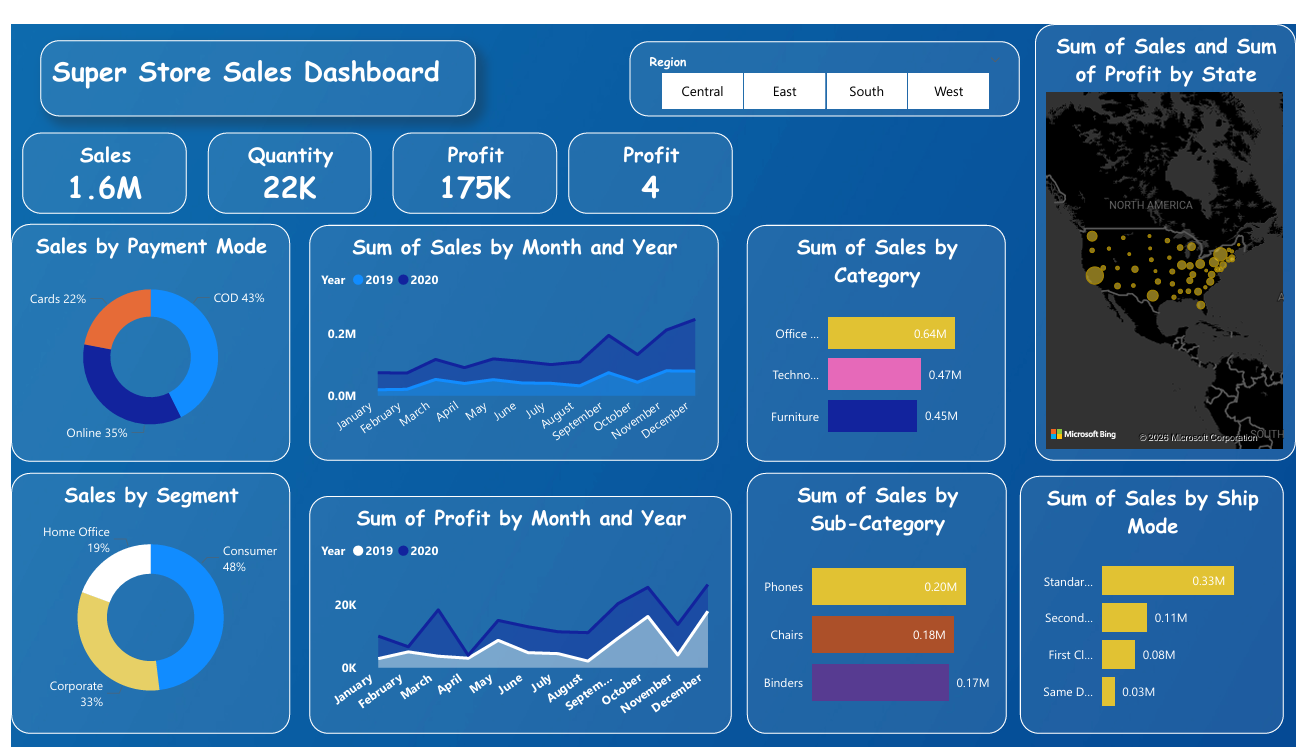
Built a supply chain dashboard tracking gross revenue, profit margins, shipment delays, and supplier performance across 7 suppliers and 16 SKUs
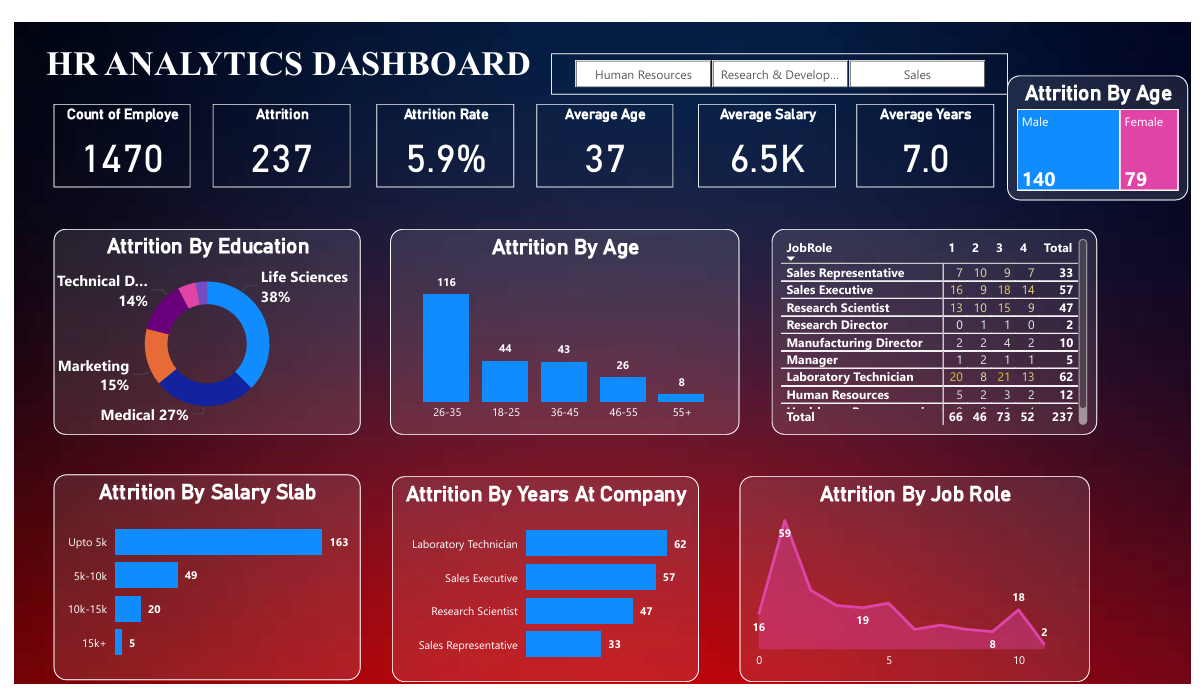
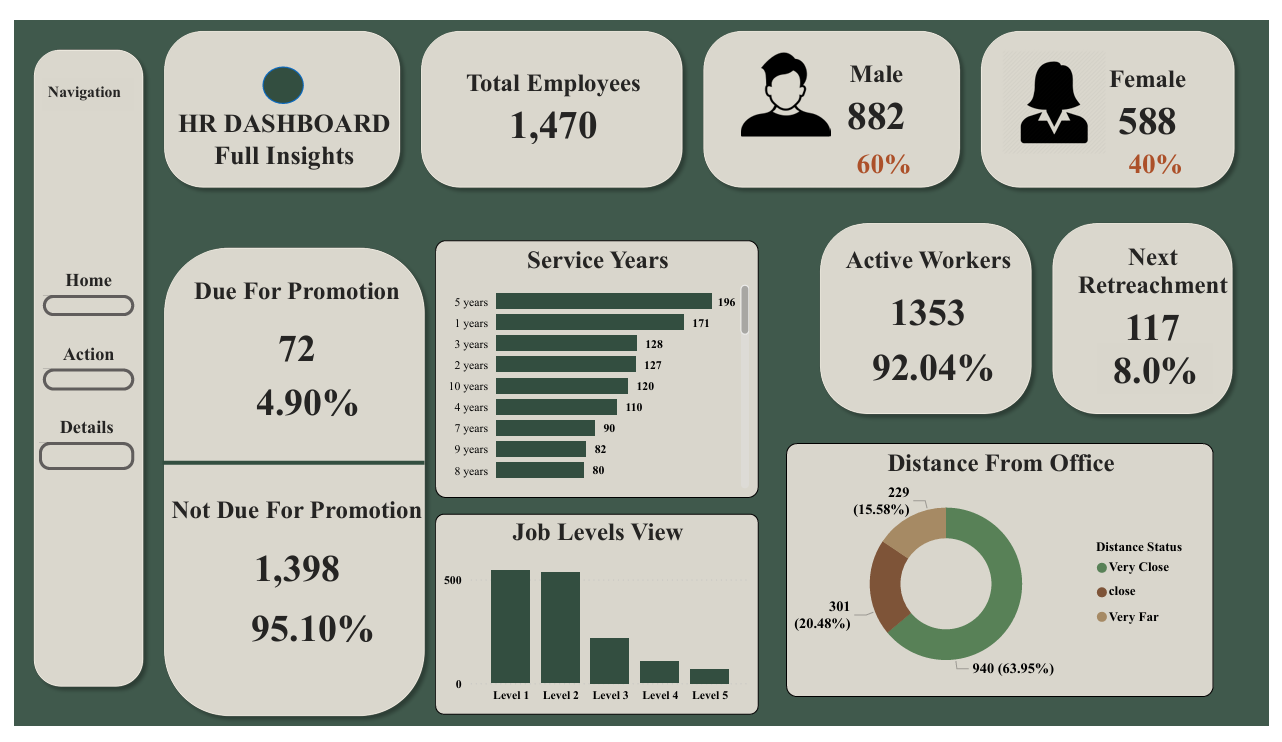
Designed an HR analytics dashboard measuring attrition rate, department headcount, gender diversity, and tenure to support workforce planning
Cleaned and analyzed a large messy dataset in Python using Pandas, Matplotlib, and Seaborn — from raw inconsistent data to clear business recommendations
Completed a Data Analyst internship at Pakistan Aeronautical Complex (PAC), Kamra — built automated Power BI reports and KPI dashboards for operational engineering teams
Power BI · DAX · Power Query · SQL (MySQL, PostgreSQL) · Python · Excel · Tableau — end-to-end from raw data to executive dashboard
BS Computer Science at COMSATS University Islamabad — CGPA 3.50/4.00, ranked in the top 5% of the batch, with IBM certification in Data Analysis with Python
COMSATS University Islamabad, Attock Campus
Top 5% of batch · CGPA 3.50 / 4.00
Fazaia Degree College ARF Kamra
87% — Board Examination
Pakistan Aeronautical Complex (PAC), Kamra
Power BI · SQL · Python · Excel · DAX · KPI Reporting
Power BI · DAX · Excel
Power BI · DAX · SQL
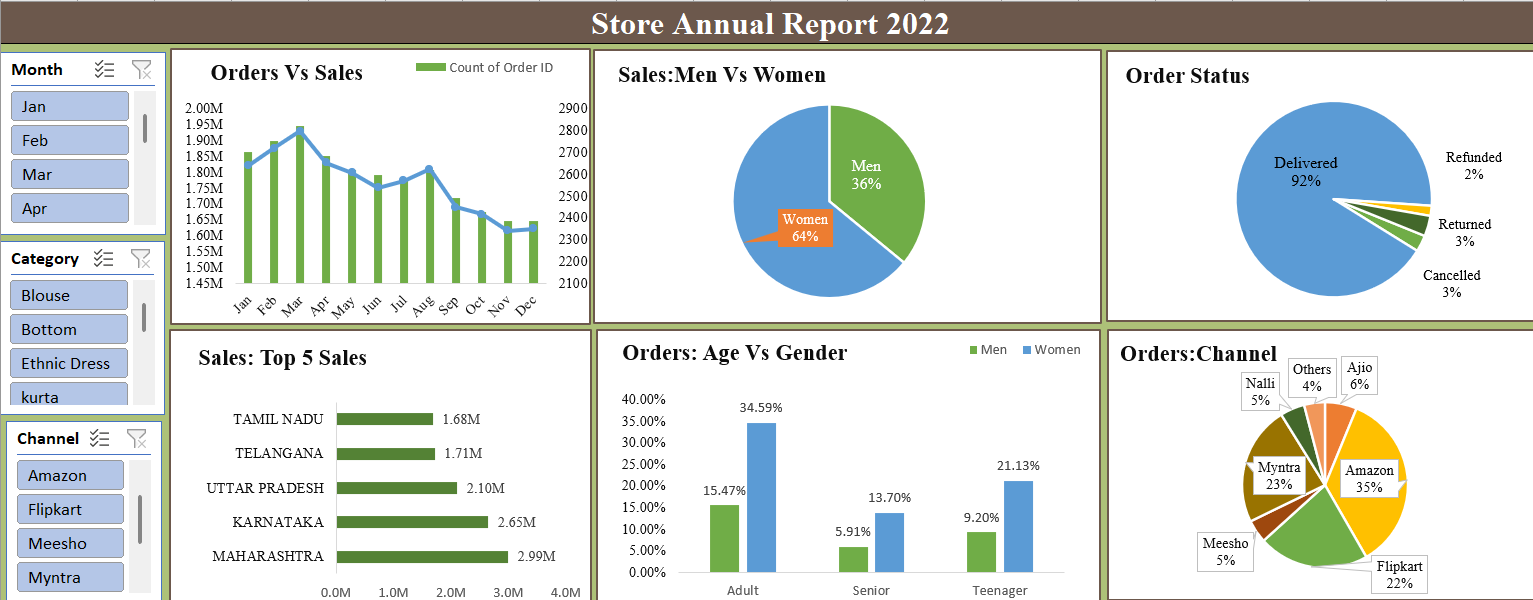
Excel · Pivot Tables · Slicers · Annual Report
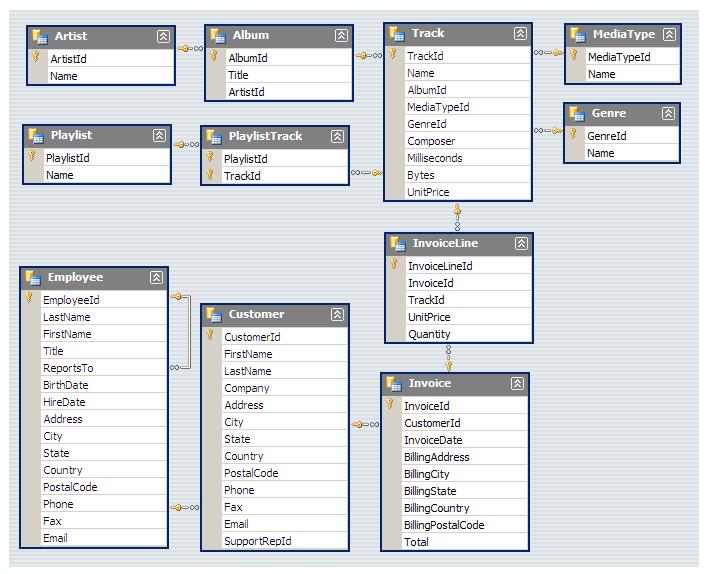
SQL · PostgreSQL · 11 Tables · 12 Queries
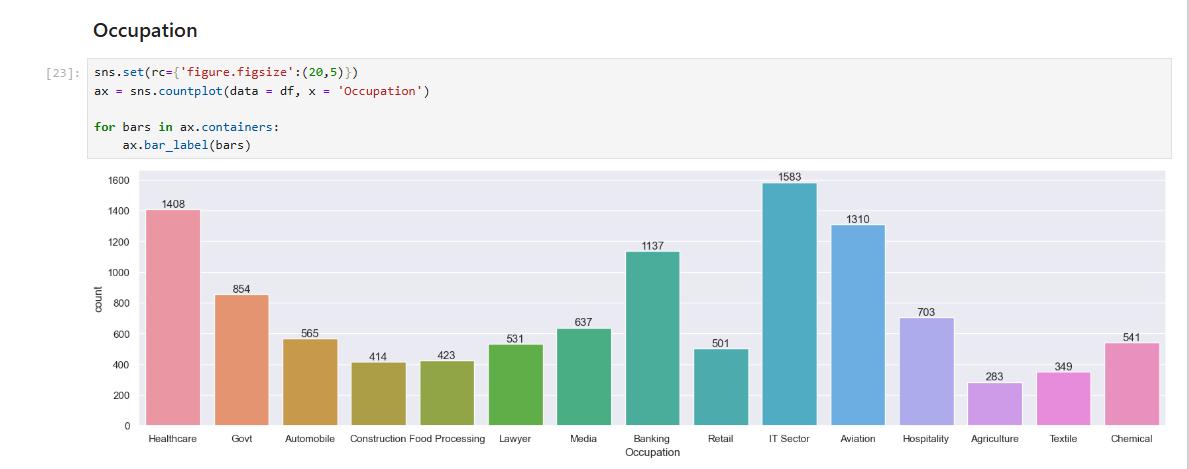
Python · Pandas · Seaborn · 11,252 Rows
Power BI · Time-Series · Forecasting
Power BI · Power Query · 3-Page Report
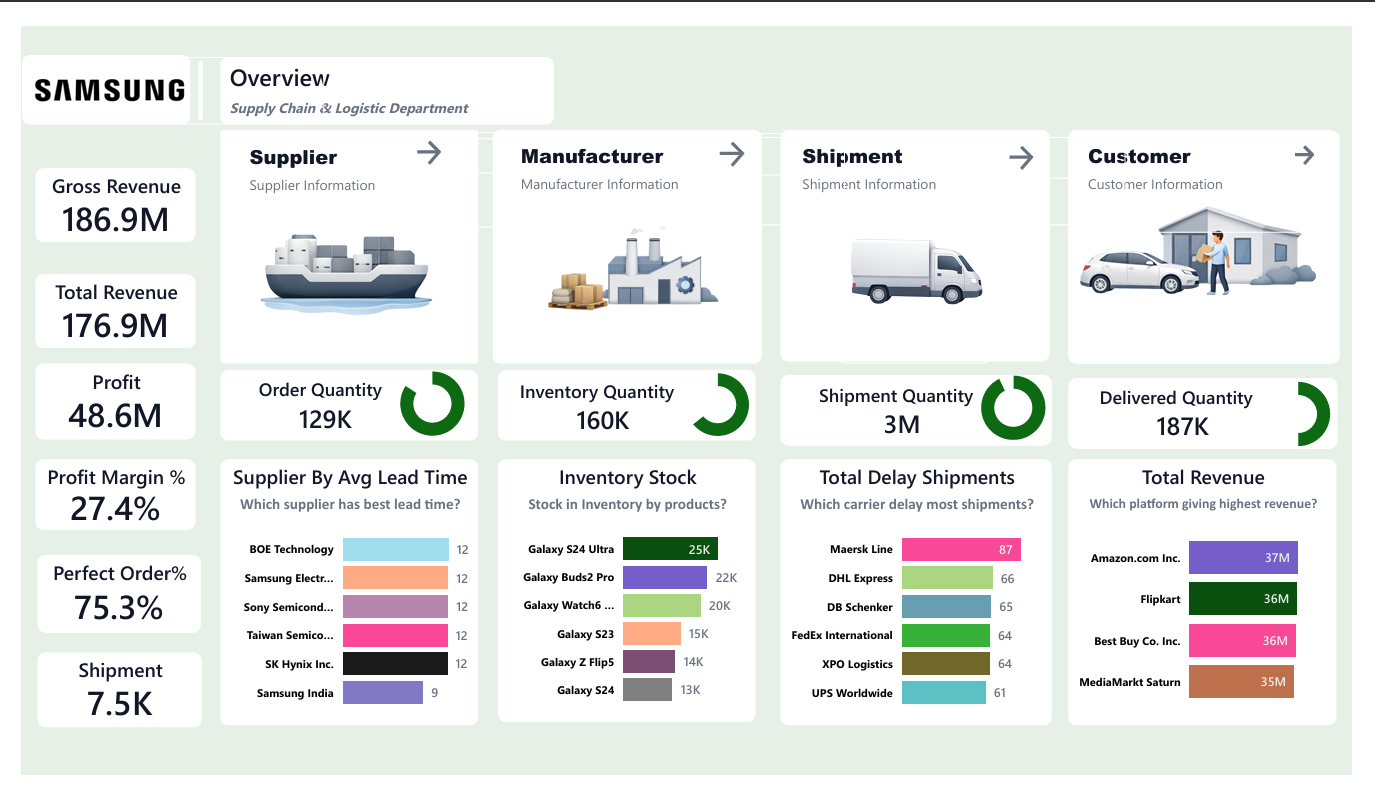
Power BI · 186.9M Revenue · 3M+ Shipments
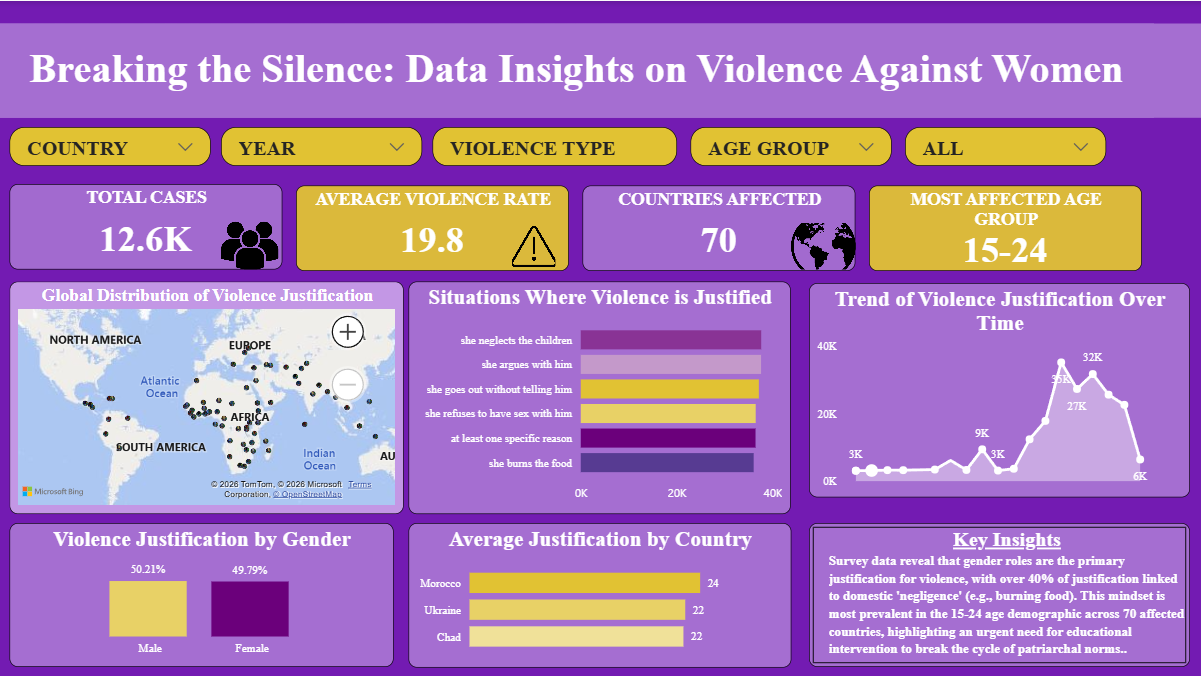
Power BI · Geographic Maps · Trend Analysis
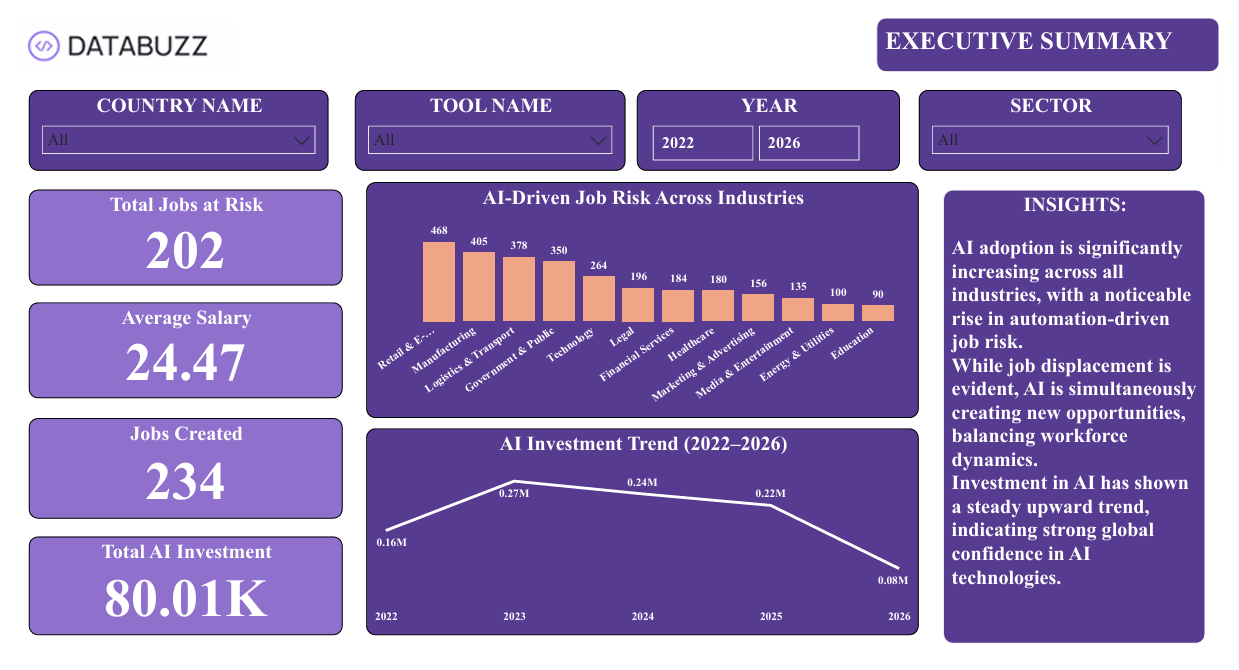
Power BI · AI Analytics · Workforce Data
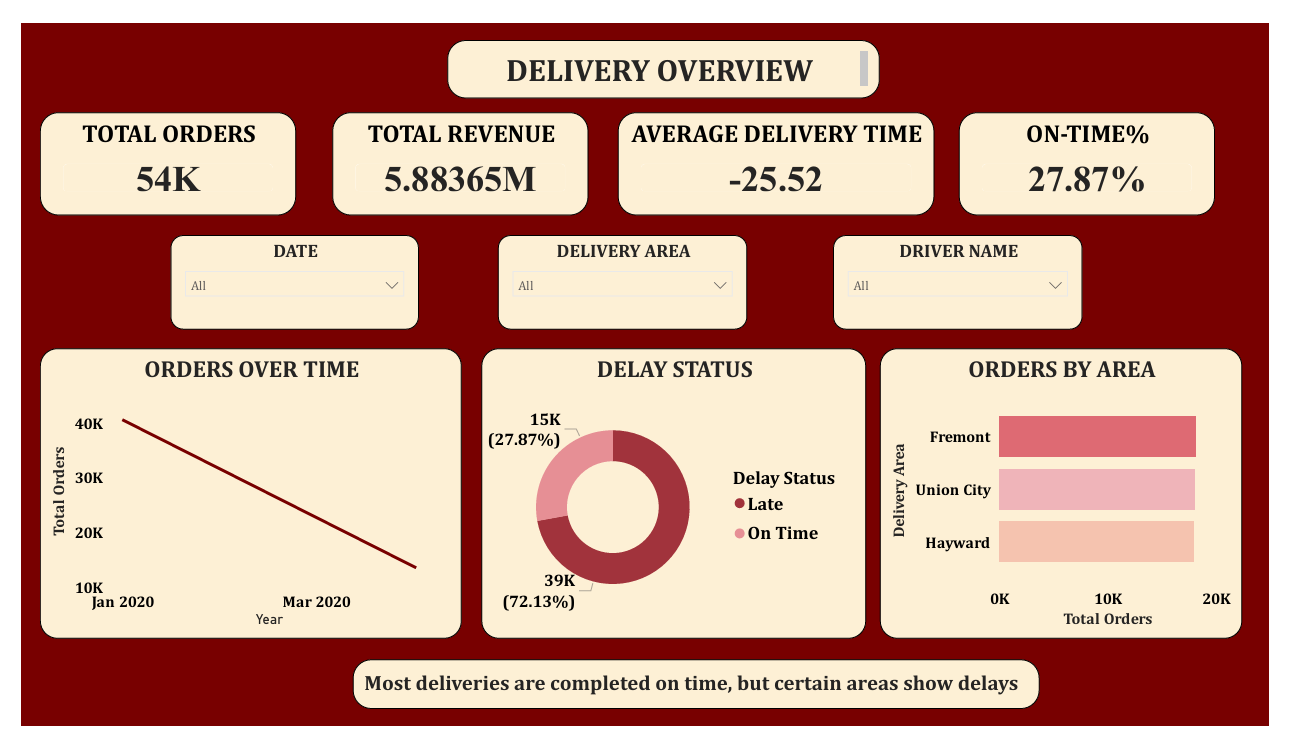
Power BI · Operations Analytics · Multi-page
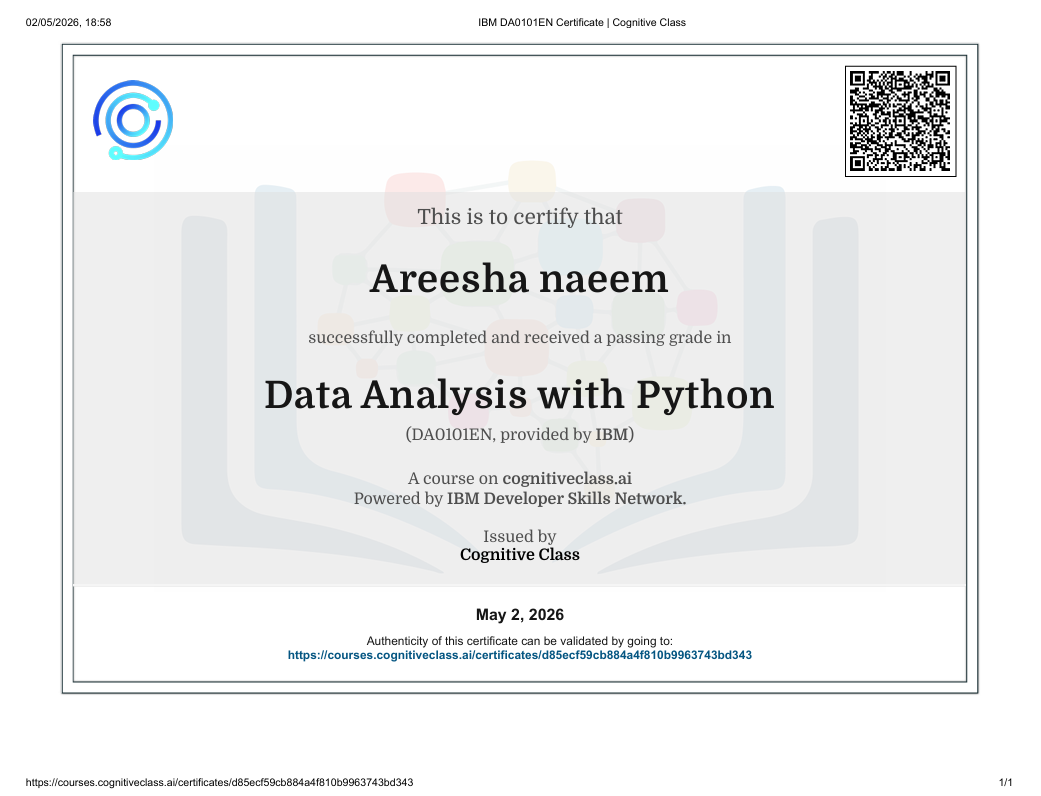
IBM · Cognitive Class · IBM Developer Skills Network
Completed IBM's official Python data analysis course covering data cleaning and preprocessing with Pandas, Exploratory Data Analysis (EDA), data visualization using Matplotlib and Seaborn, and statistical analysis and pattern recognition.
Verify Certificate
Power BI Developer Club
Completed a hands-on monthly dashboard challenge focused on real-world data analysis and visualization. Built and submitted a fully interactive Power BI dashboard judged on design, insight quality, and technical execution.
Open to Data Analyst roles, internships, and freelance analytics projects.